Iodine Emissions from the Ocean
Lower Atmosphere - Laboratory
New particles in the atmosphere: two non-classical examples (NERC standard grant NE/E005659/1)
This project (2007-2010) addressed the spontaneous formation, growth and atmospheric impacts of two types of particles: iodine oxide particles (IOPs) in the marine boundary layer, and meteoric smoke particles (MSPs) in the mesosphere.
Laboratory studies of iodine oxide particles (IOPs): Gas to particle conversion of iodine oxides
The first objective was to resolve an important uncertainty regarding the photochemistry of the OIO radical. We showed that photon absorption (490 – 620 nm) causes photolysis to I + O2 (Fig. 1), which increases enormously the ozone-depleting potential of iodine.1 Photolysis at wavelengths below 487 nm produces IO + O (Fig. 2), yielding the first accurate heat of formation for OIO.2 We then made direct observations, using laser photo-ionization coupled with Time-of-Flight mass spectrometry, of I2O4 and I2O5 (Fig. 3)3. High-level quantum theory calculations were used to determine the thermal stabilities of these higher iodine oxides, which were shown to be the essential building blocks of IOPs.4,5
 Figure 1. Left axis: wavelength dependence of the secondary iodine atom signal (squares) and simultaneously measured OIO photolysed fraction (triangles), compared to reference OIO absorption cross sections at 1.3 nm FWHM resolution (solid line) in three spectral ranges. Right axis: iodine atom quantum yield at selected wavelengths (empty circles).
 Figure 2. Determination of the O-IO bond dissociation energy. The IO photofragment is observed for wavelengths shorter than 495 nm (squares in upper panel). The data has been corrected for the wavelength dependent intensity of the photolysis laser. The absorption cross section for OIO (thin line in upper panel) is used to derive the IO quantum yield shown in the lower panel (circles) using the equation shown in the figure, where C is a constant encompassing [OIO], laser fluence and LIF calibration factor. The solid line is the inverted internal energy cumulative distribution function for OIO f(λ).
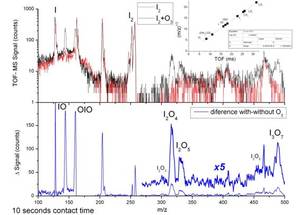 Figure 3. Upper panel: TOF-MS spectra with (black) and without (red) O3 added (note the logarithmic scale). The inset shows the mass to charge ratio square root vs time of flight calibration fit. Bottom panel shows the difference between the spectra in the upper panel.
Two complementary photochemical techniques were then used to explore the formation kinetics of small IxOy clusters, and their growth to large IOPs (diameters up to 50 nm). This work showed that spontaneous formation of IOPs always occurs once the higher iodine oxides form, but that the subsequent particle growth is inhibited at high relative humidity and temperature (Fig. 4 and 5).6 It was shown that particles can form in the absence of ozone (enhancement of IOP production in the presence of ozone can be explained by the oxidation of iodine atoms produced by the IO self reaction).
 Figure 4. Measured size distributions for IOPs formed under dry conditions (solid lines) and at 90% RH (dashed lines) under equivalent experimental conditions at two iodine atom production rates.
 Figure 5. Top panel: Measured particle size distributions at three different cell temperatures in system B (all other experiment conditions the same). Bottom panel: Arrhenius plot of iodine particle mass produced in 6 s, versus temperature.
We also demonstrated that the uptake of sulphuric acid vapour is extremely efficient (Fig. 6), which is a key factor in accelerating the growth of IOPs.6 Through a study of the temperature-dependent deliquescence/efflorescence of I2O5/HIO3 particles (Figs. 7 and 8), we showed that IOPs should have glassy properties in the atmosphere.7
 Figure 7. A series of microscope images of I2O5 crystals at 298 K: (i) at low RH, (ii) just below the deliquescence point and (iii) at the point of deliquescence, and (iv) shows aqueous solution droplets.
Figure 8. A series of microscope images from the efflorescence experiments with droplets formed from crystals of (NH4)2SO4 (top), I2O5 (middle), and HIO3 (bottom).
These experimental results were then used to develop an IOP atmospheric model for interpreting the results from recent field campaigns (Fig. 9).8
 Figure 9. The number of potential CCN formed after 24 h, as a function of the mean daytime IO mixing ratio at 10 m. The [IO] is changed by altering the sea-to-air flux of I2 species in addition to the halocarbon flux. Two cases are illustrated in the figure to show the sensitivity to the background aerosol surface area (ASA), which is set to a typical remote MBL value of 1×10⁻⁶ cm2 cm−3 (red) or an ultra-clean value of 1×10⁻⁷ cm2 cm−3 (blue).
References:
- Gómez Martín et al., Photochemistry of OIO: Laboratory study and atmospheric implications, Geophys. Res. Lett., 2009, 36, L09802.
- Gómez Martín and Plane, Determination of the O-IO bond dissociation energy by photofragment excitation spectroscopy, Chem. Phys. Lett., 2009, 474, 79-83.
- Gómez Martín et al., On the mechanism of iodine oxide particle formation, PCCP, 2013, 15, 15612-15622.
- Kaltsoyannis and Plane, Quantum Chemical Calculations on a Selection of Iodine-Containing Species (IO, OIO, INO3, (IO)2, I2O3, I2O4 and I2O5) of Importance in the Atmosphere, PCCP, 2008, 10, 1723-1733.
- Gálvez, et al., A theoretical study on the formation of iodine oxide aggregates and monohydrates, PCCP, 2013, 15, 15572-15583.
- Saunders et al., Studies of the Formation and Growth of Aerosol from Molecular Iodine Precursor, Zeit. Phys. Chem., 2010, 224, 1095-1117.
- Kumar et al., Physical Properties of Iodate Solutions and the Deliquescence of Crystalline I2O5 and HIO3, Atmos. Chem. Phys., 2010, 10, 12251-12260.
- Mahajan et al., Measurement and Modelling of Reactive Halogen Species Over the Tropical Atlantic Ocean, Atmos. Chem. Phys., 2010, 10, 4611-4624.