OSIRIS
Middle/Upper Atmosphere - Fieldwork (Past Research)
Odin Satellite
We have used satellite-borne measurements of the Na dayglow at 589 nm to determine the absolute Na concentration profile in the mesosphere/lower thermosphere (MLT). Observations were made from ODIN, a dual-mission (astronomy and aeronomy) satellite launched in 2001 by the Swedish National Space Board (SNSB) and the space agencies of Canada (CSA), Finland (TEKES) and France (CNES). The height of the Sun-synchronous orbit is 620 km, with ascending node at 1800 local time. ODIN carries two instruments: the Sub-Millimetre Radiometer (SMR) for both astronomy and aeronomy, and The Optical Spectrograph and InfraRed Imaging System (OSIRIS) for aeronomic studies only. OSIRIS measures irradiance in the limb at wavelengths between 280 and 800 nm, with a resolution of ~ 1 nm. The default observing mode employs limb-scanning from the troposphere to the MLT. However, in July each year a period is dedicated to studying the northern hemisphere summer mesopause region, when restricted limb-scanning from 70 to 110 km is carried out. Together with Prof. Jorg Gumbel at Stockholm University we have developed an algorithm, based on optimal estimation retrieval theory, to retrieve the absolute Na density profile from the Na dayglow radiance profile. We have now analysed 2 years of data (2003-2004) to determine a global picture of the Na layer, which shows the effects of seasonal temperature variation, noctilucent clouds, and the diurnal tide on the layer. The vertical resolution of the retrieval (~2 km) is also sufficient to detect sporadic Na layers.
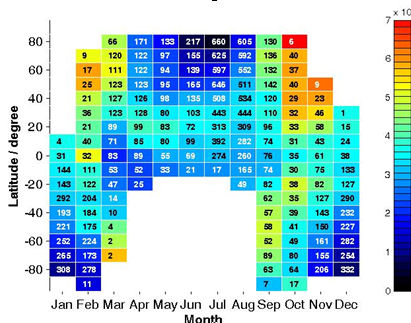 Grid plot of the monthly-averaged total Na column density, zonally averaged in 10o latitude bins. The data is compiled from OSIRIS limb-scanning radiance measurements during 2003 and 2004. The number inside each grid box is the number of integrated Na profiles that were averaged to yield the mean column density.
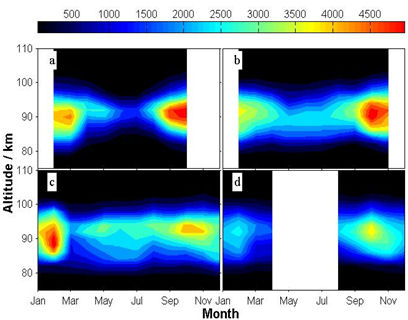 Seasonal variation of the zonally- averaged Na density profile from 75 km to 110 km at four latitude bands centred at: (a) 70 oN, (b) 40 oN, (c) the equator, and (d) 20 oS.
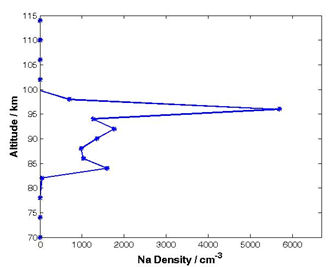 Example of a Sporadic Na layer
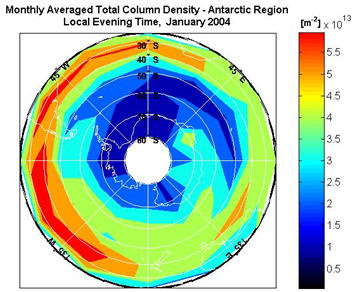 Measurements of the Na layer from space, using the OSIRIS spectrometer on the ODIN satellite. Note the depletion of the Na above 50 oN, due to uptake on polar mesospheric clouds.